The ProPublica website has analyzed federal education data from the 2009-2010 school year as a means of seeing if states offer equal access to educational opportunities.
According to the site, “This is the first nationwide picture of exactly which courses are being taken at which schools and districts across the country. More than three-quarters of all public school children are represented.”
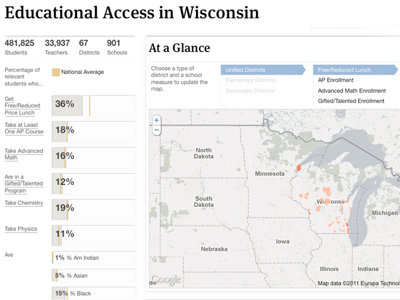
A chart on the left side of the main page shows how each state is faring in relation to the others. Despite the colorful graphic, if you compare the numbers, Wisconsin is at or within a percentage point of the national average for kids in AP courses, advanced math and chemistry. The state is two points ahead of the nation in gifted/talented program participation and 3 points ahead for children taking physics classes.
Here are some of the numbers for Milwaukee as compared to the state average:
- Number of students: 71,620 (MPS), 418,825 (Wisconsin)
- Percentage of inexperienced teachers (in first or second year): 8 percent (MPS and Wisconsin)
- Get free/reduced lunch: 77 percent (MPS), 36 percent (Wisconsin)
- Average number of AP courses: 0 (MPS), 9 (Wisconsin). (Note: ProPublica’s Jennifer LaFleur says that zero usually signifies a rounding down of a number below one percent.)
- Take at least one AP course: 7 percent (MPS), 18 percent (Wisconsin)
- Take advanced math (high school): 0 percent (MPS), 16 percent (Wisconsin). (Note: This is one “rounding down” that I’m not sure I trust. I searched the MPS high schools and most high schools had students taking these classes: 1 percent take it at Custer; 7 percent at Madison; 8 percent at Bradley Tech; 9 percent at Vincent; 10 percent at King; 11 percent at High School of the Arts, South Division and Bay View; 12 percent at Hamilton; and 20 percent at Riverside. Only three traditional district high schools show zero and one of them is Reagan, which seems unlikely. The others are Pulaski and Marshall.)
- Are in a gifted/talented program (at schools offering them): 100 percent (MPS), 12 percent (Wisconsin) (Note: 100 percent seems high except that at gifted and talented schools, all children might take part in the program.)
- Take chemistry (high school): 0 percent (MPS), 19 percent (Wisconsin) (Note: There are no stats for chemistry and physics on individual schools pages.)
- Take physics (high school): 0 percent (MPS), 11 percent (Wisconsin)
- Are American Indian: 1 percent (MPS and Wisconsin)
- Are Asian: 4 percent (MPS), 5 percent (Wisconsin)
- Are black: 59 percent (MPS), 15 percent (Wisconsin)
- Are Hispanic: 21 percent (MPS), 11 percent (Wisconsin)
- Are white: 14 percent (MPS), 67 percent (Wisconsin)
Here is raw data for MPS schools, on a school by school basis. You can also see individual school data. An example of that is here.
Interestingly, ProPublica says that, nationally:
“While we found some relationship between the proportion of minority students at schools and access to programs, we found the strongest relationship with the percent of students getting free- reduced-price lunches – a variable often used in education research to estimate poverty at schools.”
 i evaluate to yes even if there's no image
  i evaluate to yes even if there's no image
  i evaluate to yes even if there's no image
  i evaluate to yes even if there's no image
  i evaluate to yes even if there's no image
  i evaluate to yes even if there's no image